Instructions
Use strsvr to decode aceinna-user data
Use strsvr to decode aceinna-user data format. Decode aceinna format data and display information in monitor dialog and save it in files.
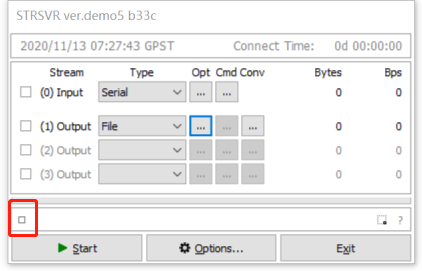
Set input stream parameter
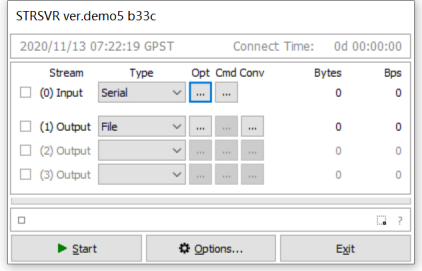
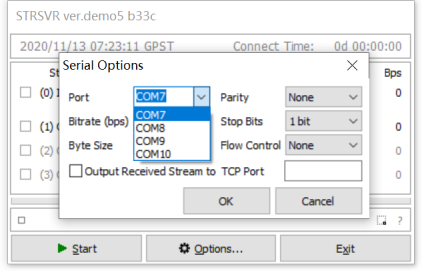
Select serial for (0) input. Click “opt” button to open the Serial Options dialog.
Select the first serial port in the serial Options dialog.
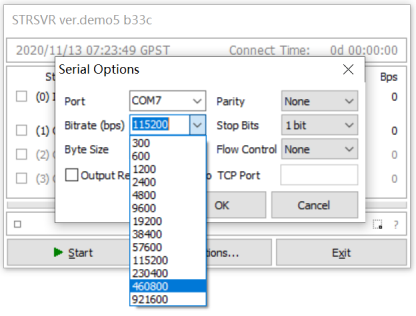
Bitrate is selected as 460800.
Set output files path
Select the path to save the file. For example: C:/Users/zhangchen/Desktop/rtklog/.

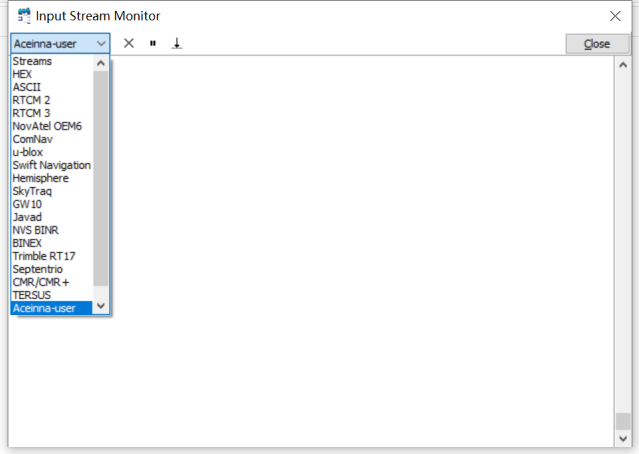
Show the data in monitor dialog and save file
Click the small square button to open Input Stream Monitor dialog.
Select the aceinna-user format.
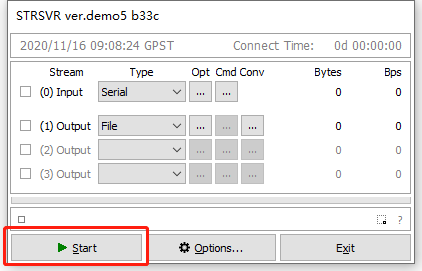
Click “start” button to start receiving data.
Strsvr is running.
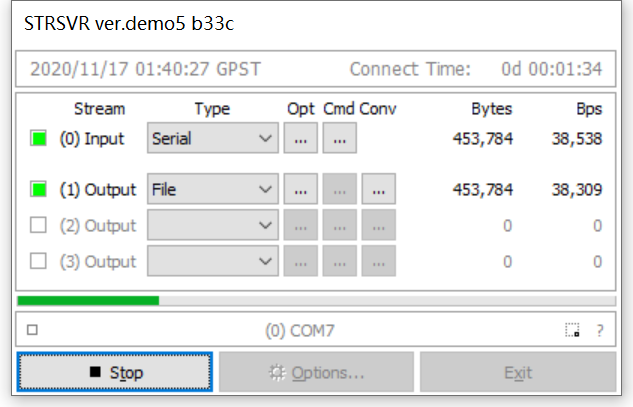
The data decoding information is showed in monitor dialog.

The file is saved in the previous output path.

Use RTKLIBNAVI to decode aceinna-user data
Aceinna-raw data is the result outputfrom OpenRTK330. Using rtklibnavi to connect the first serial port of openrtk330, the RTK processing result data can be recognized These data can be displayed by SNR plot, sky map and GND Trk.

Set input stream parameter
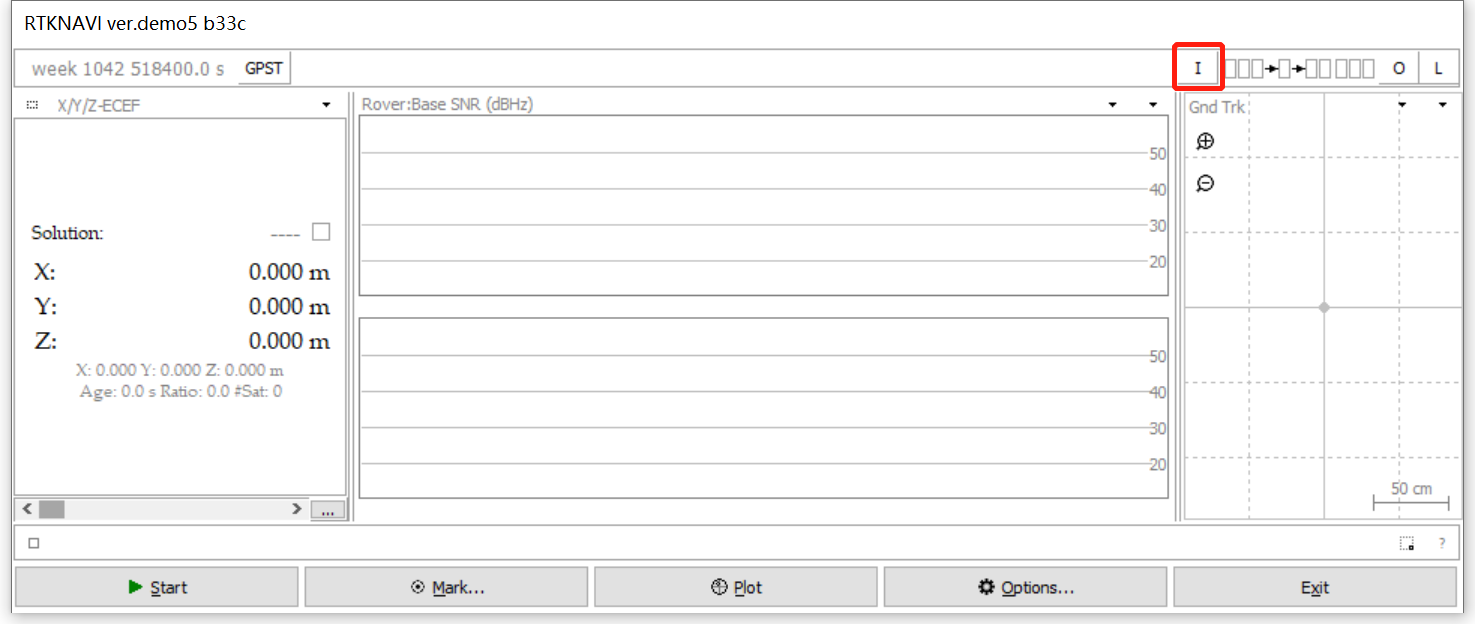
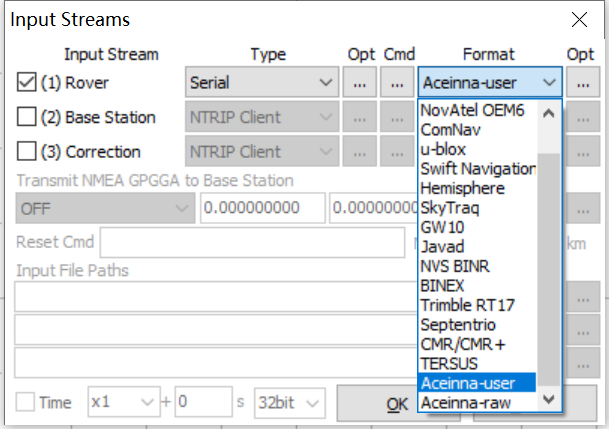
Click the ‘I’ button to open Input Streams dialog.
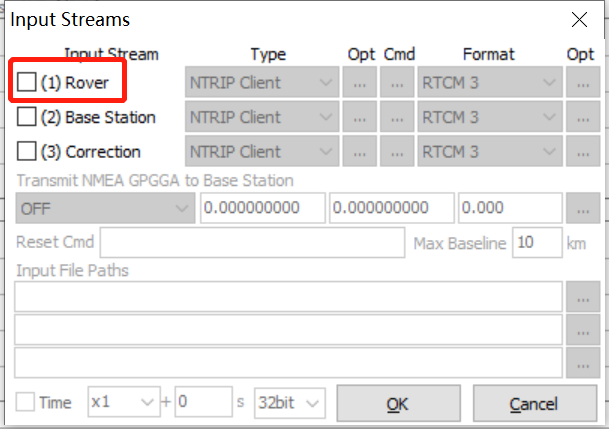
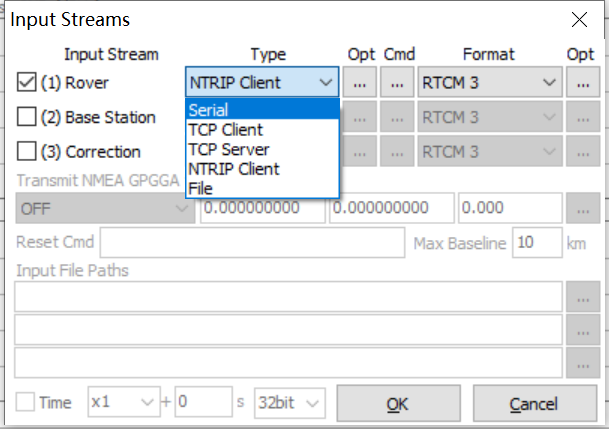
Check (1) Rover in the Input Streams dialog.
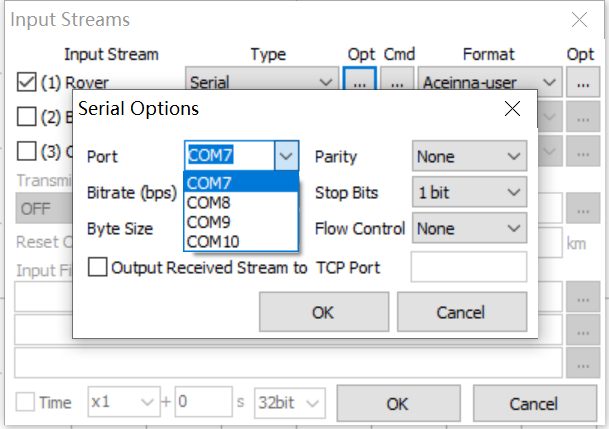
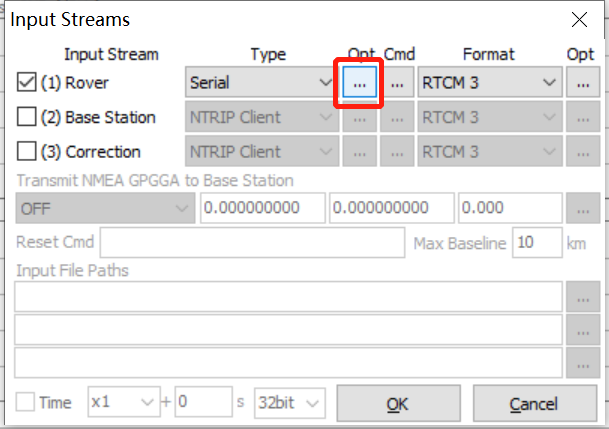
Select “serial” in the type option.

Click “opt” button to open the Serial Options dialog.

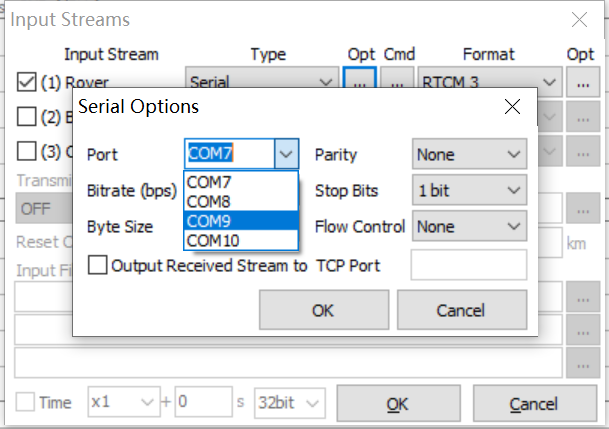
Select the frist serial port in the serial Options dialog.
Bitrate is selected as 460800.
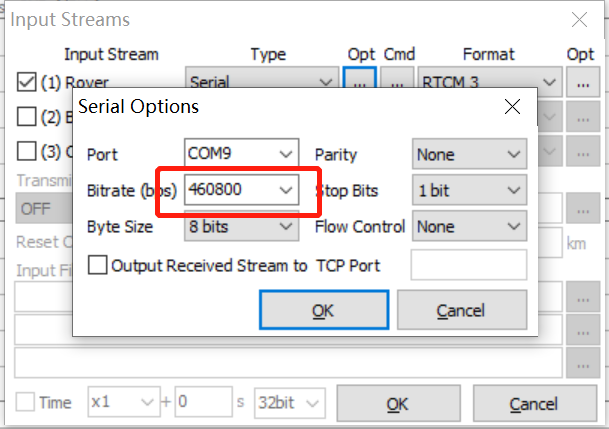
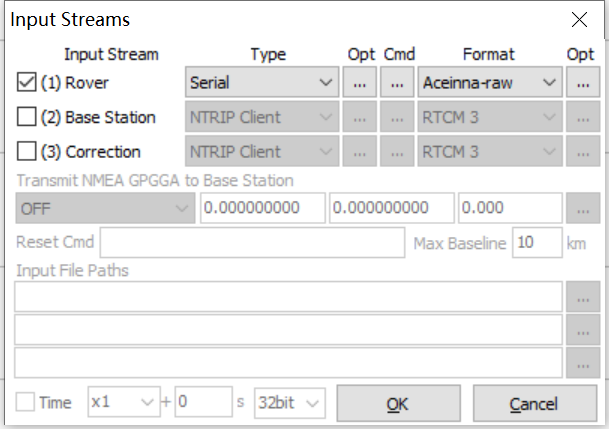
Format is selected as Aceinna-raw.
Set output log files path
Select the path to save the file. For example: C:/Users/zhangchen/Desktop/rtklog/.
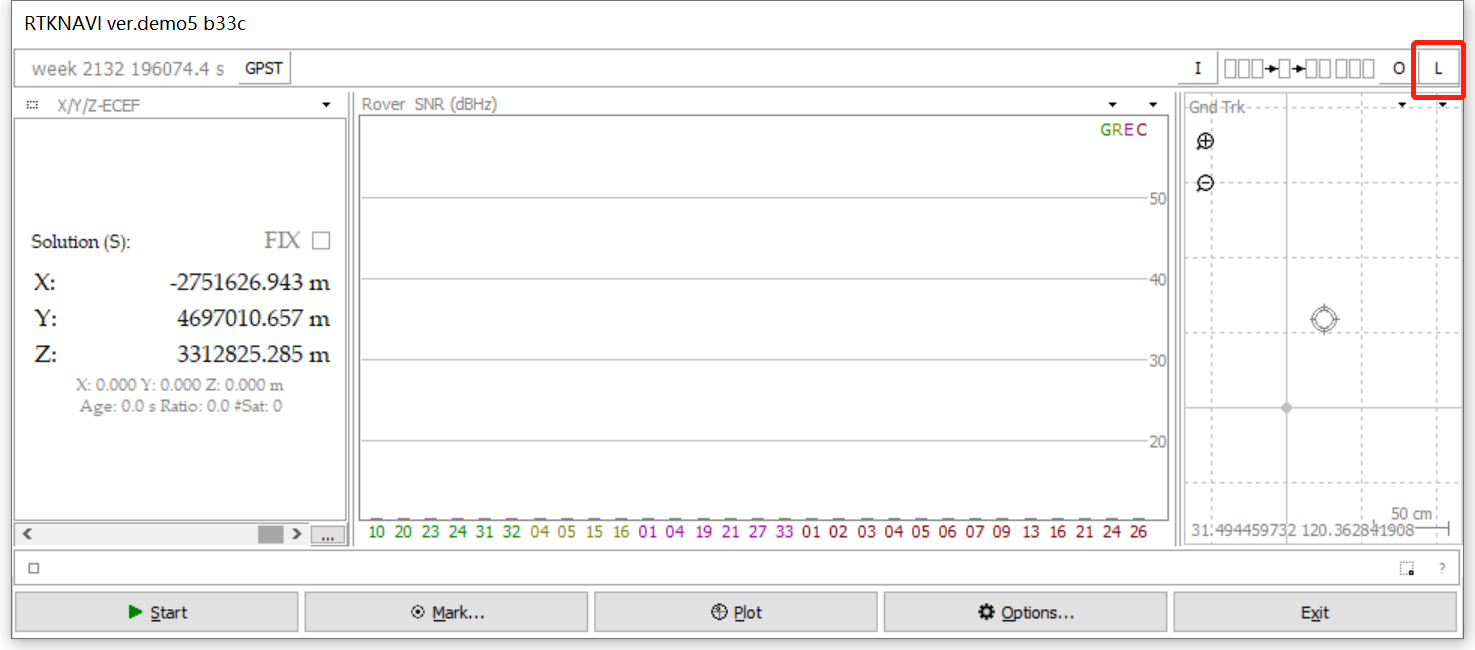
Click the ‘L’ button to open Log Streams dialog.
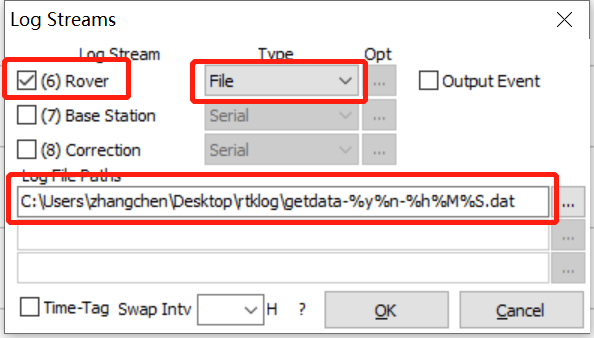
Check (6) Rover ,select File type and input the log file paths. Click “OK” button.
Start to receive data
Click the “start” button to start receiving the data.
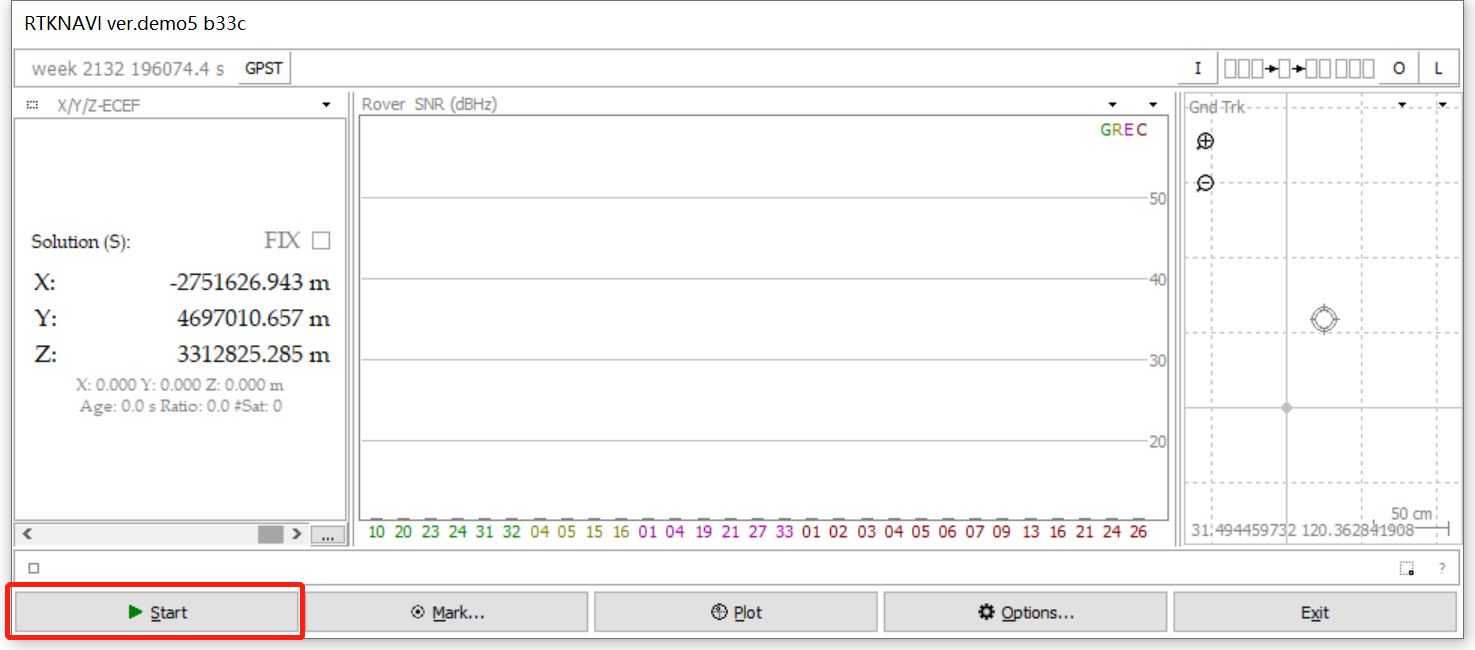
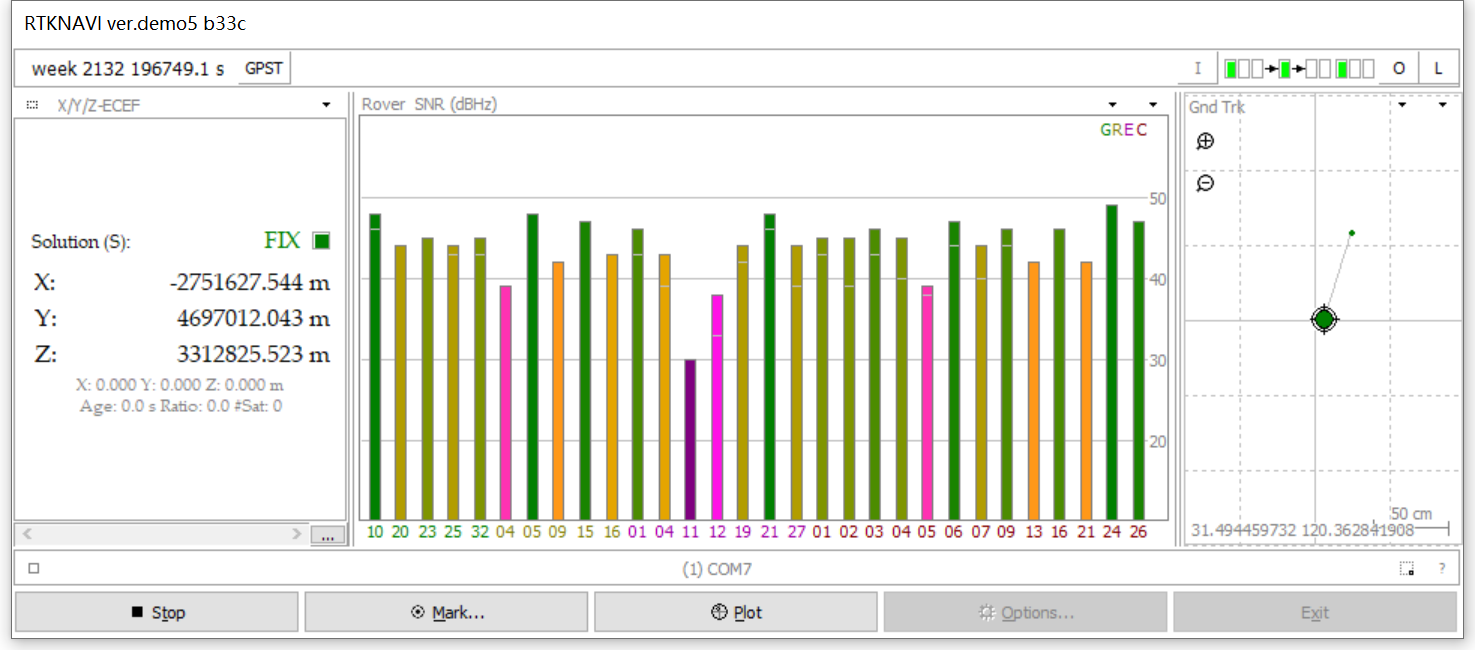
When receiving the data, the SNR bar is plotted.
Click the arrow button to switch view (SNR bar, sky map, positioning coordinates, horizontal error scatter, position error timeseries in north, east and up).
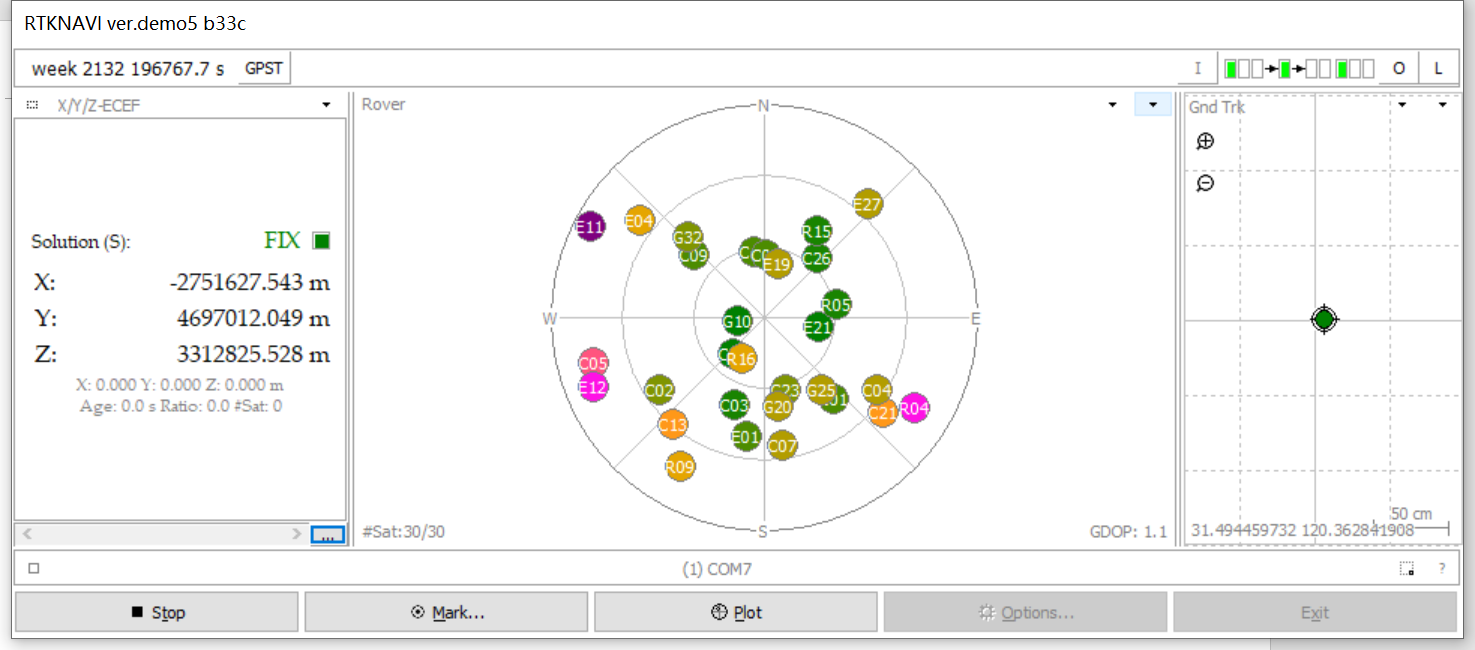
The sky map.
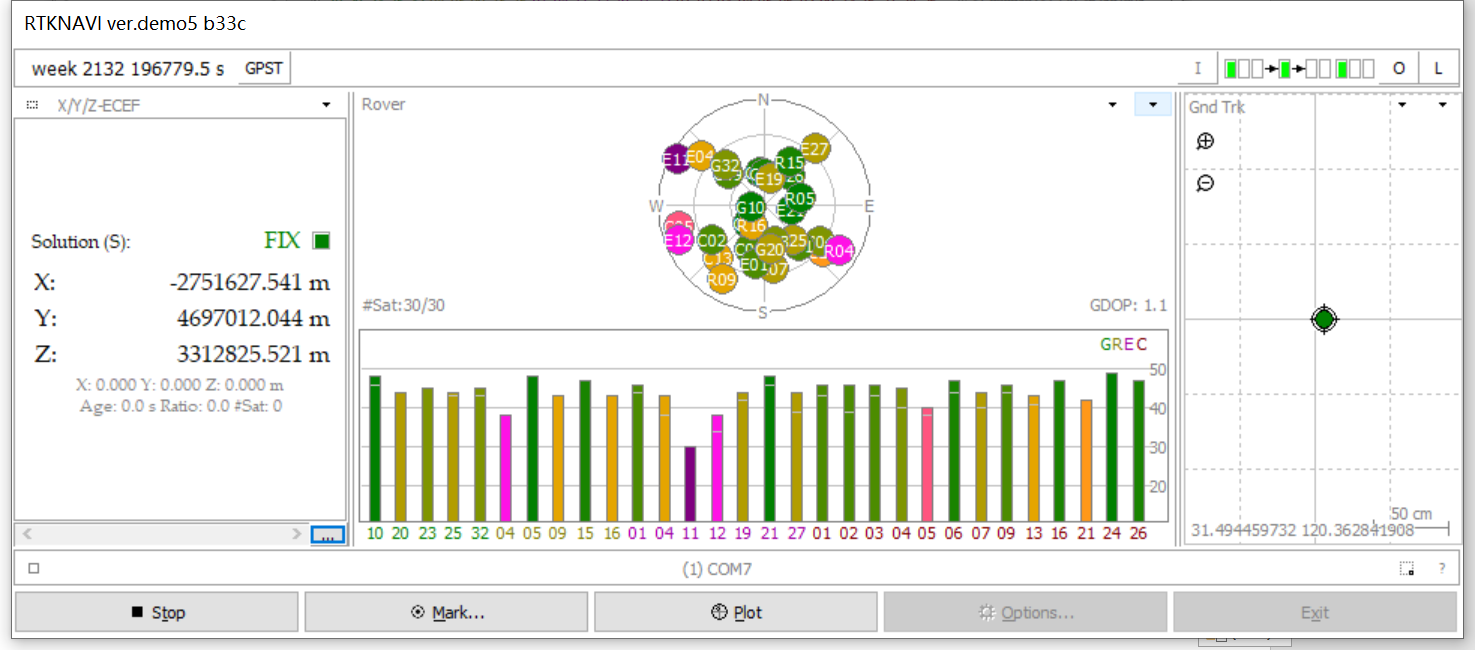
Both sky map and SNR plot.
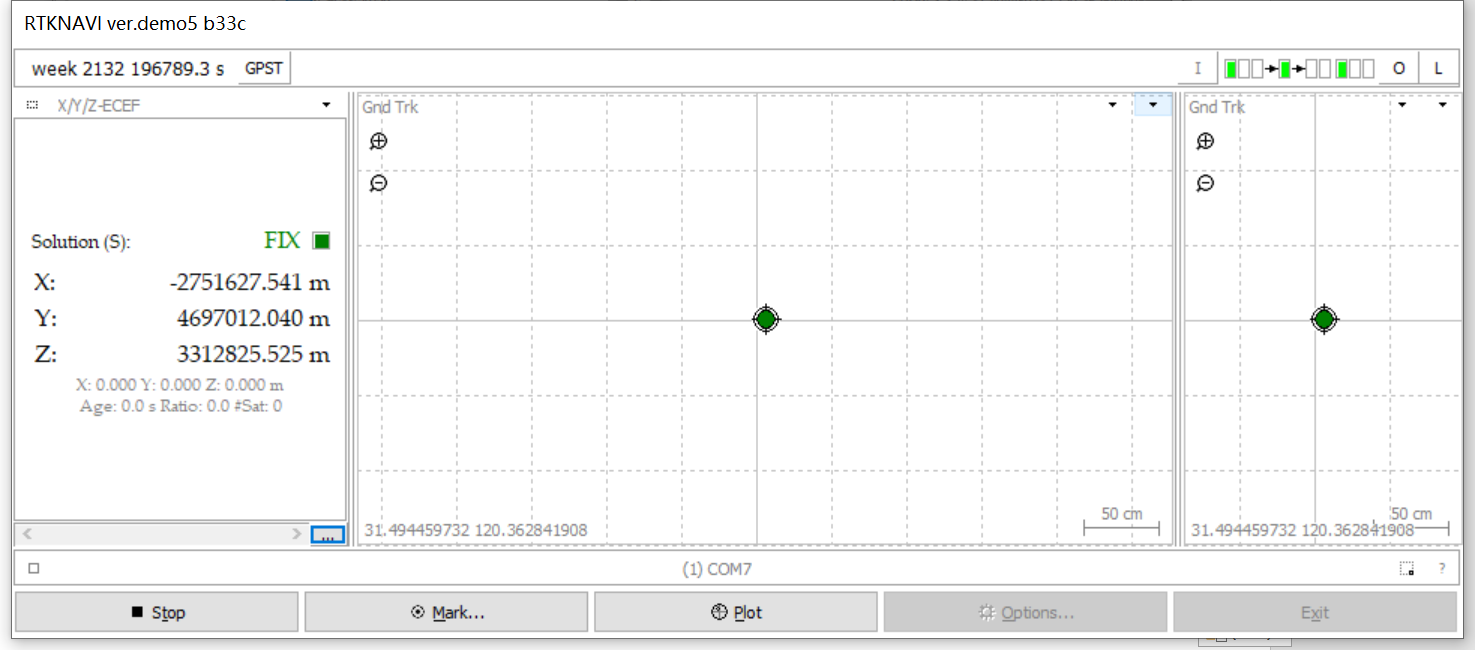
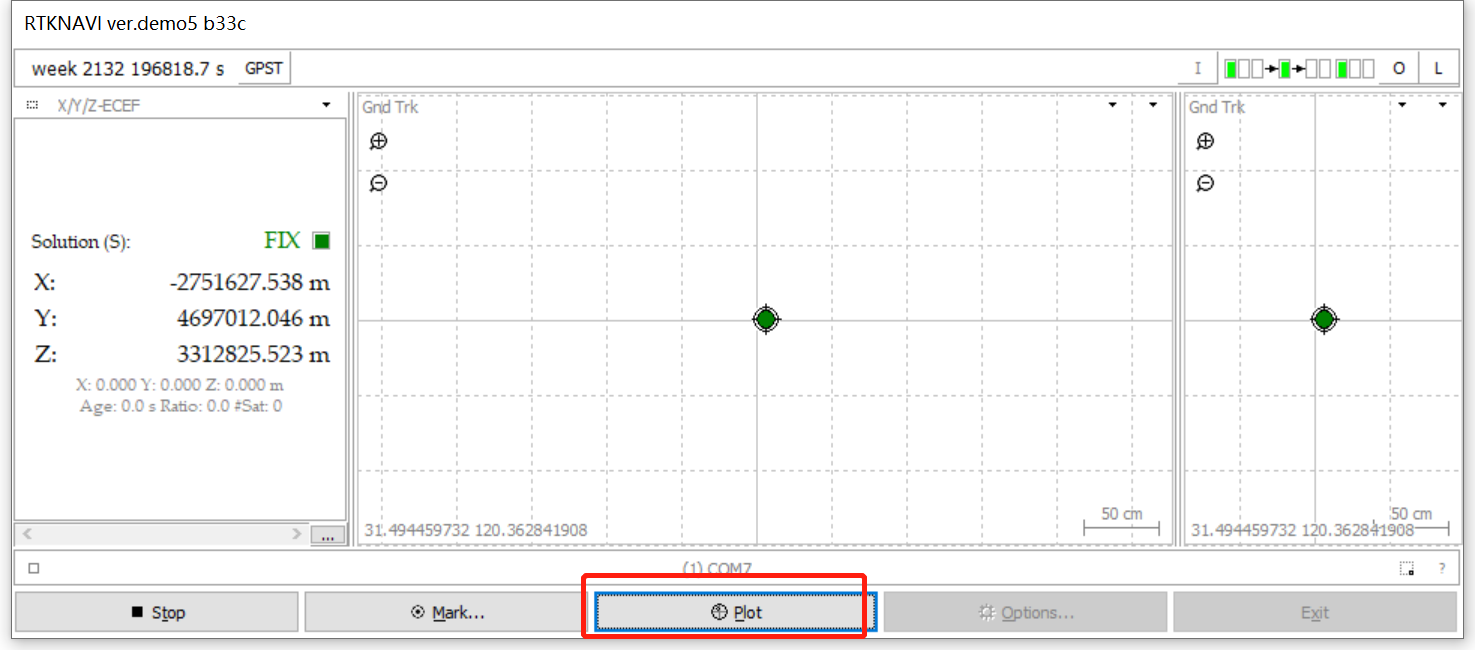
The Gnd Trk.
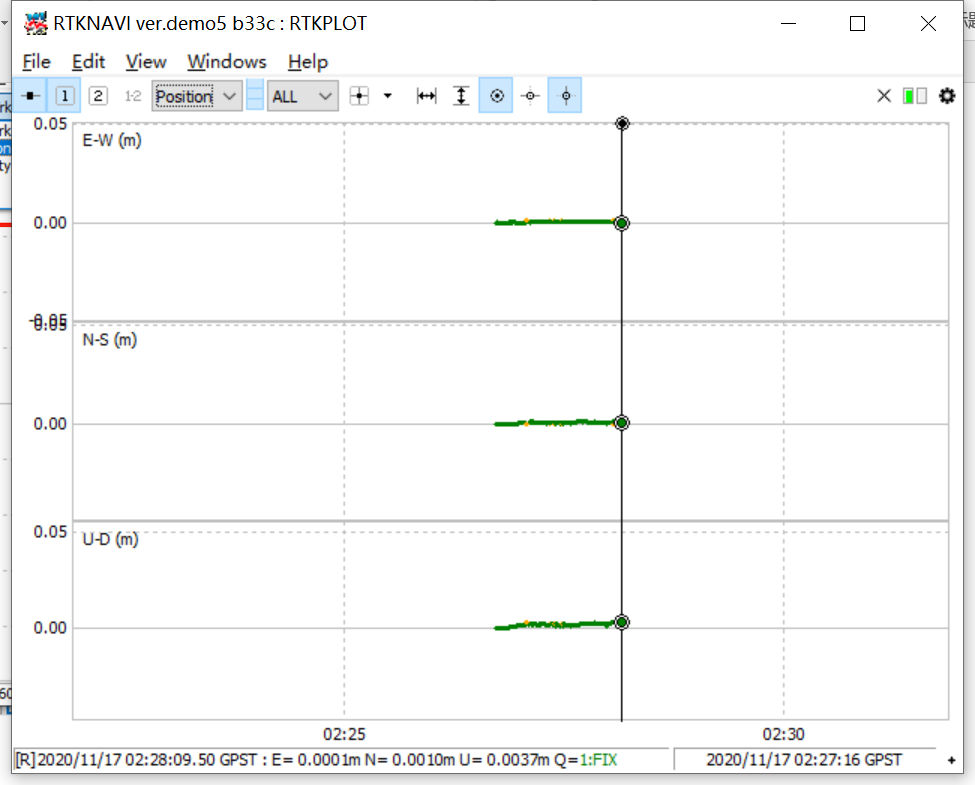
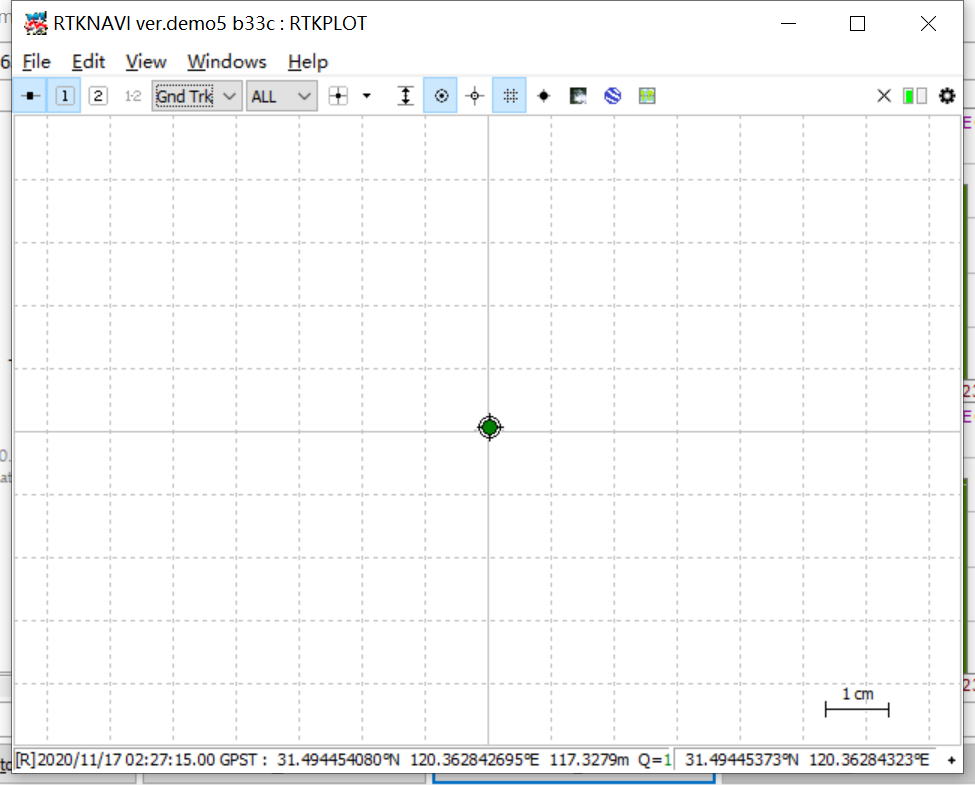
Click the “Plot” button to open RTKPLOT.
The RTKPLOT dialog.
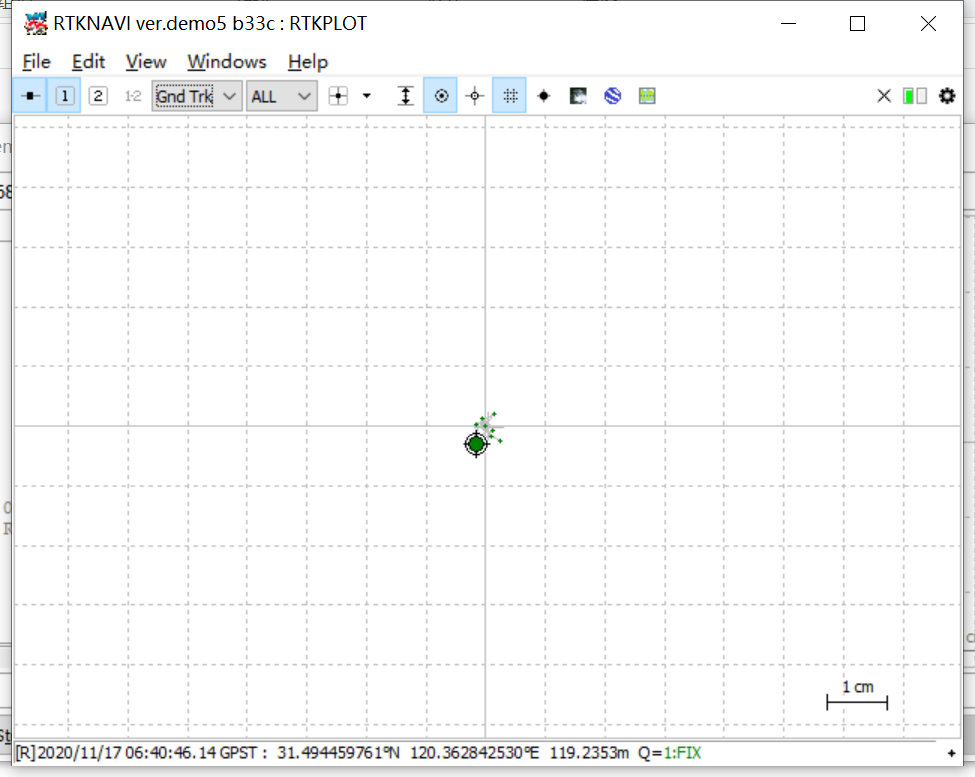
Select the drop-down list to switch views.
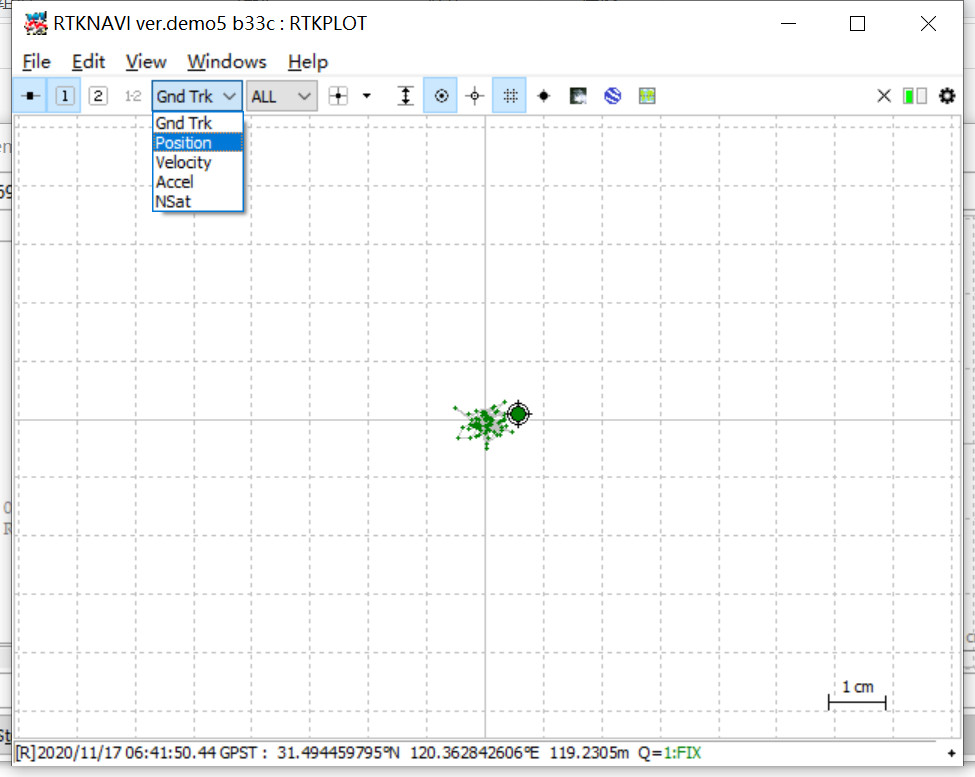
The Position views.

Click “stop” button to stop receiving data.
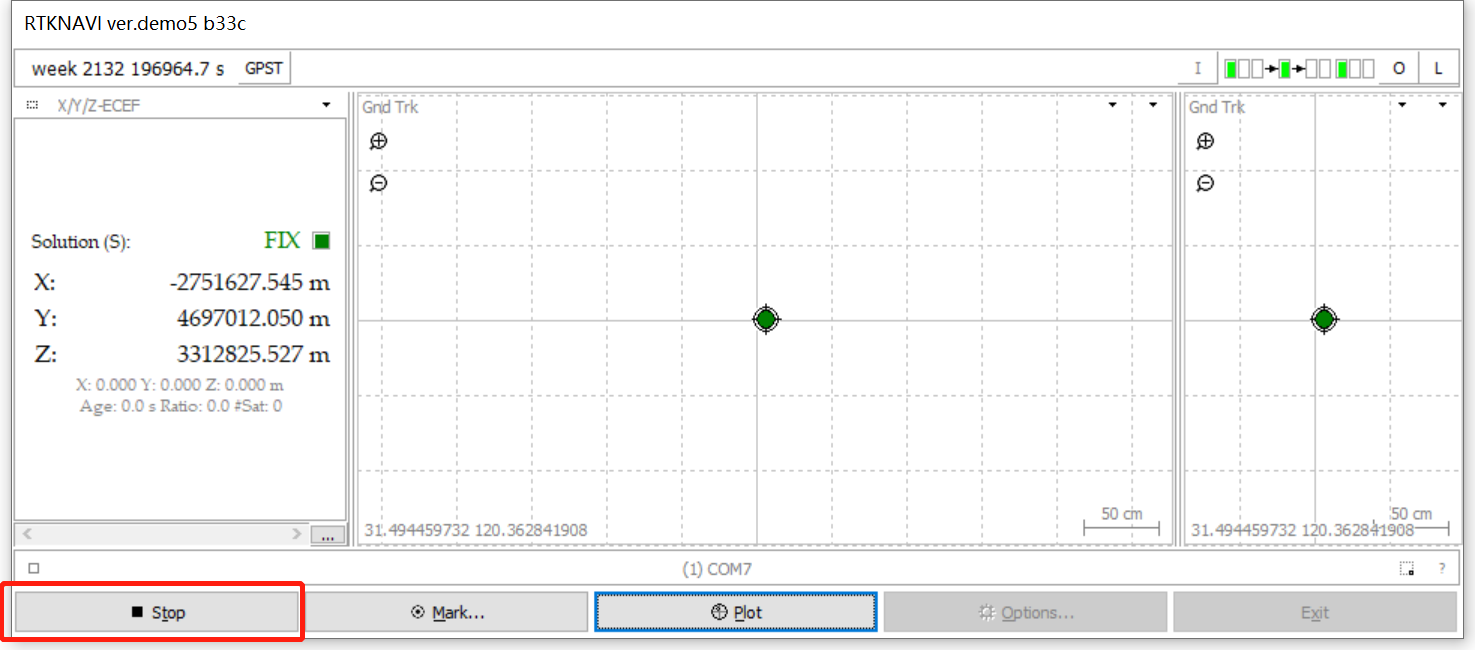
The file is saved in the previous output path.

Use RTKLIBNAVI to decode aceinna-raw data
Aceinna-raw data contains the original data of rover station and base station. Using rtklibnavi to connect the third serial port of openrtk330, the rover station and the base station information can be read at the same time. These data can be displayed by SNR plot, sky map, baseline and GND Trk. At the same time, these data can also be used for RTK processing.

Set input stream parameter
Click the ‘I’ button to open Input Streams dialog.

Check (1) Rover in the Input Streams dialog.

Select serial in the type option.
Click “opt” button to open the Serial Options dialog.
Select the third serial port in the serial Options dialog.
Bitrate is selected as 460800.

Format is selected as Aceinna-raw.
RTK processing config
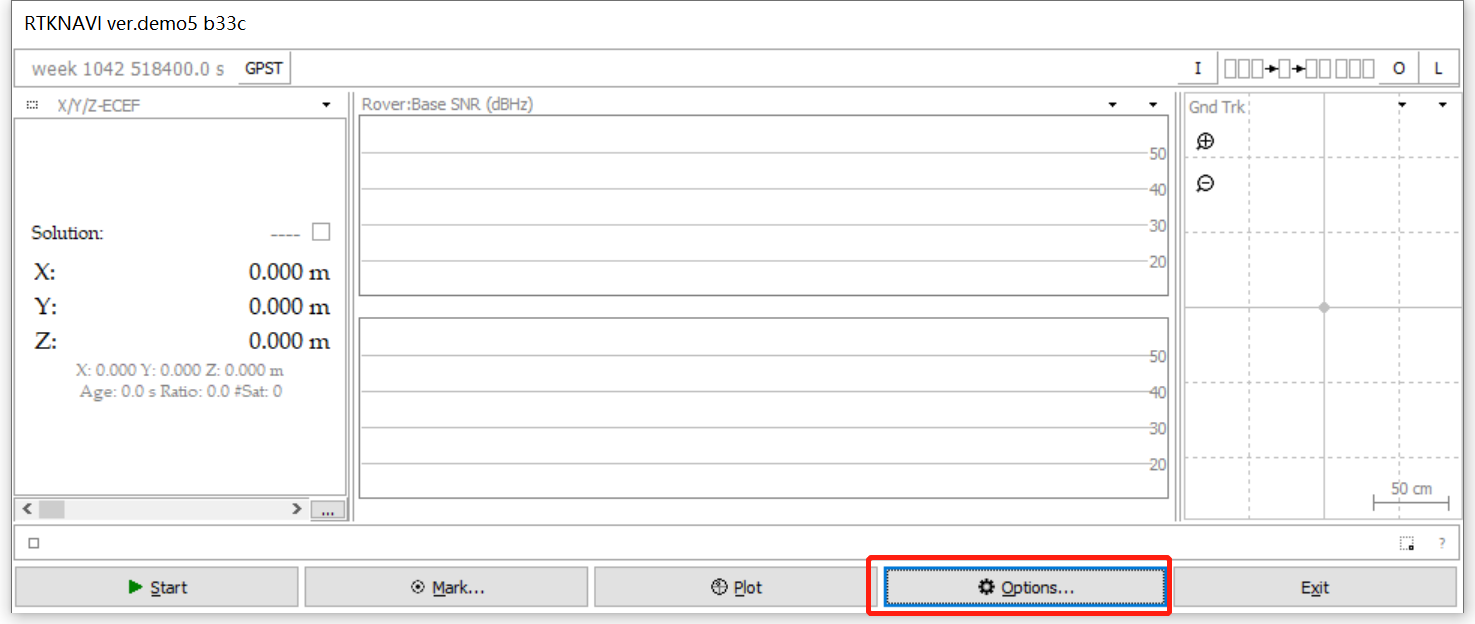
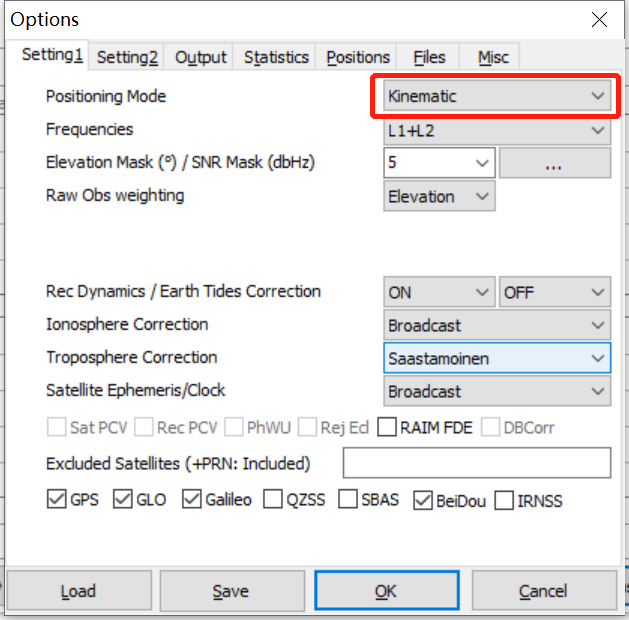
Close the Input Streams dialog and click the “options” button to open the options dialog.
In the options dialog, choose the RTK posting mode option as “kinematic” or “static”.
Start to receive data
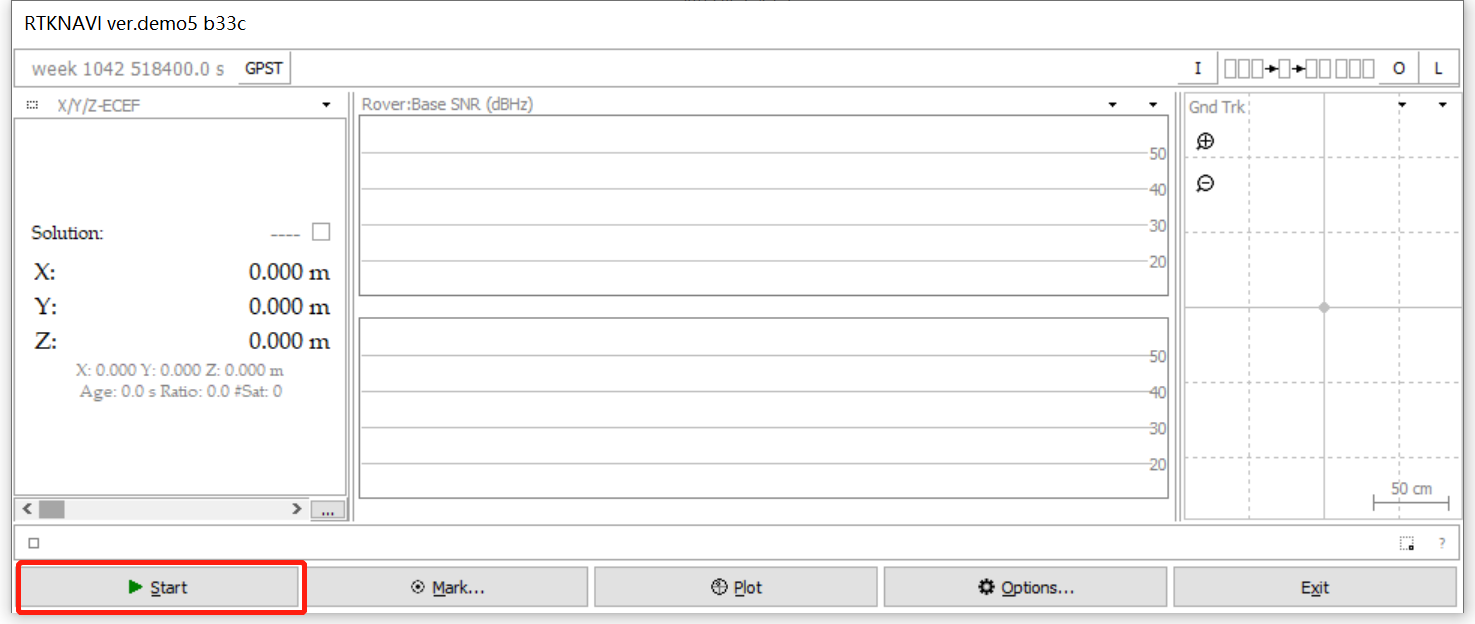
Click “start” button to start receiving the data.
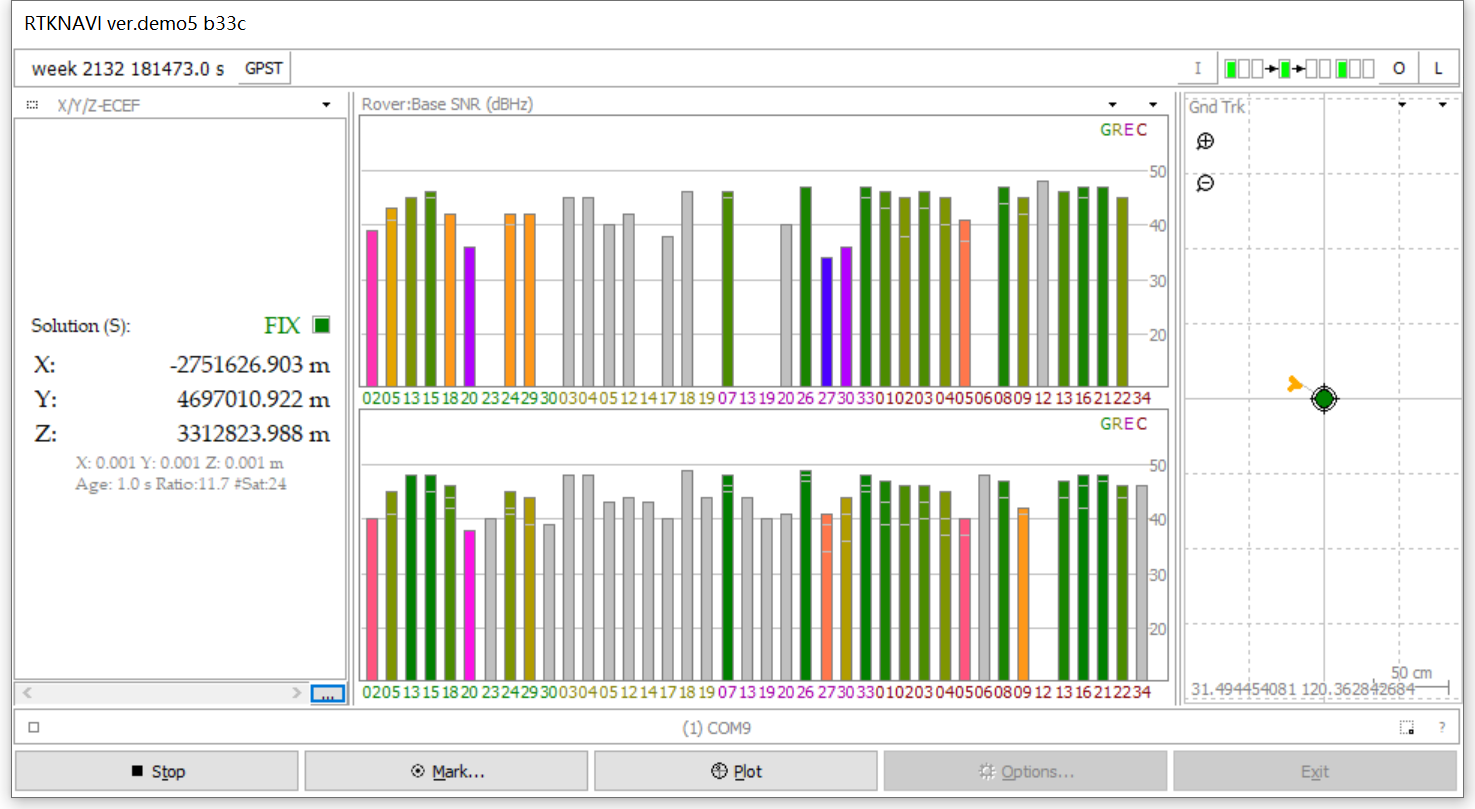
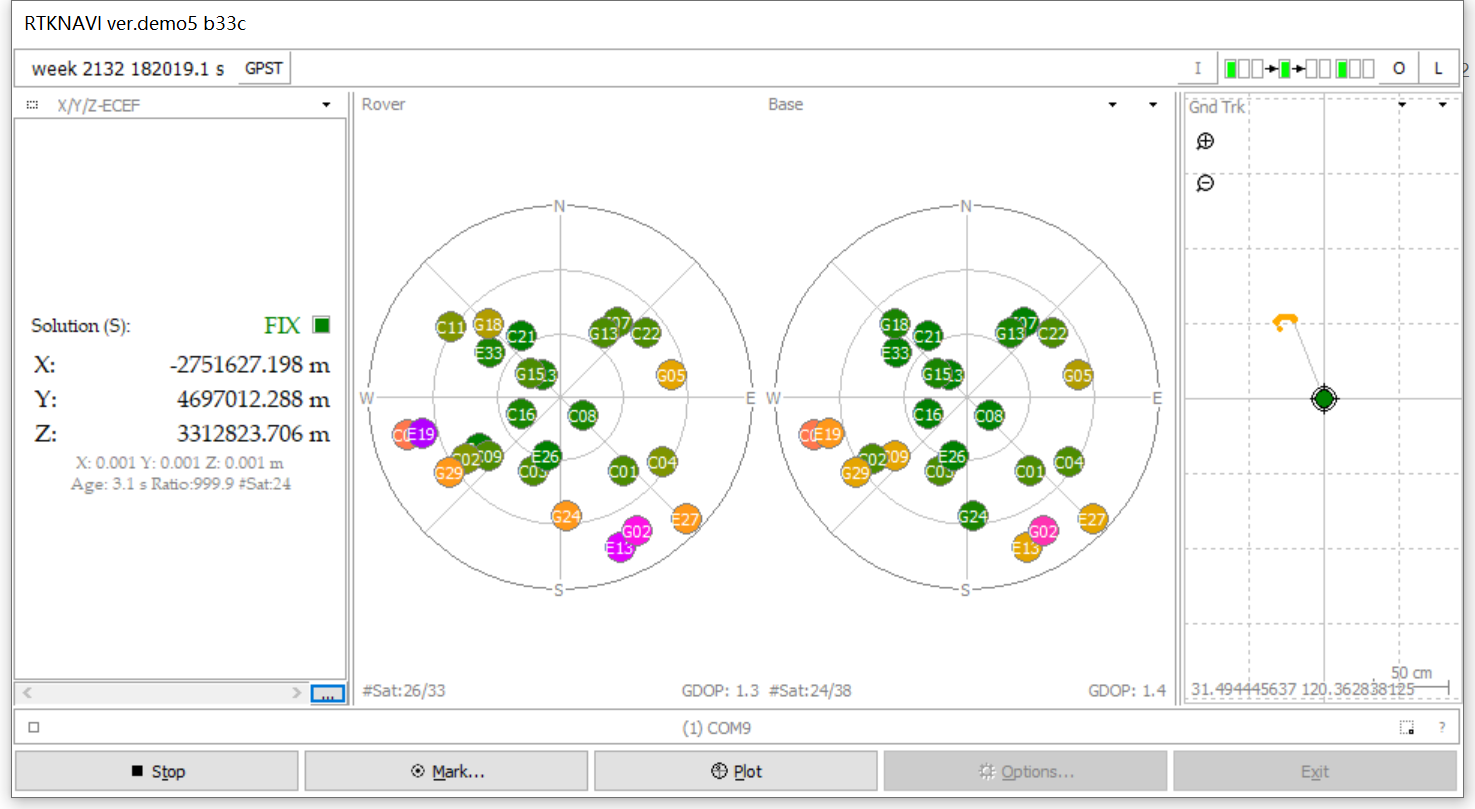
When receiving the data, the SNR map of Rover and base according to the data will appear in GUI, and RTK results will be displayed.
Click the arrow button to switch view (SNR bar, sky map, positioning coordinates, horizontal error scatter, position error timeseries in north, east and up).
The sky maps.
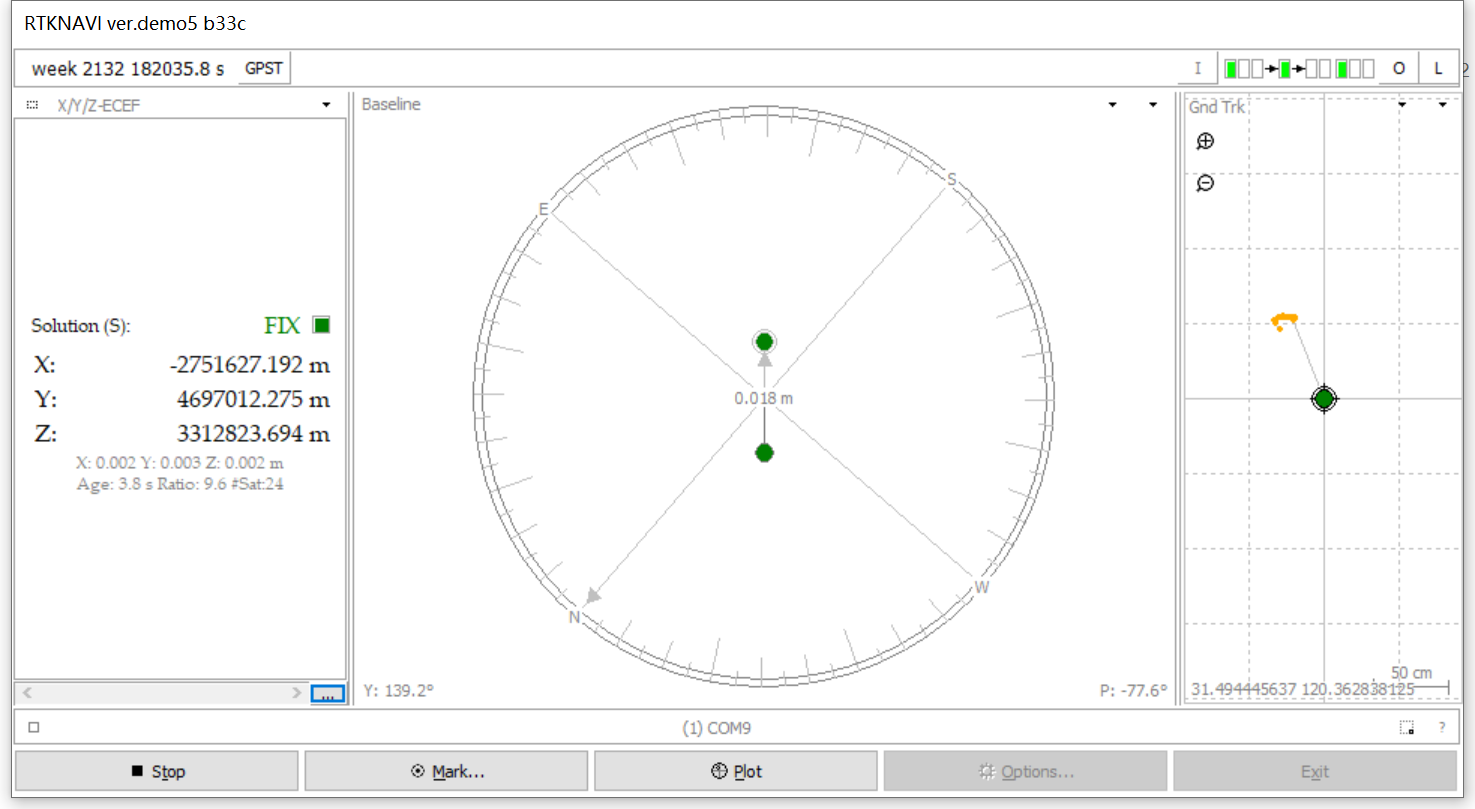
The baseline.
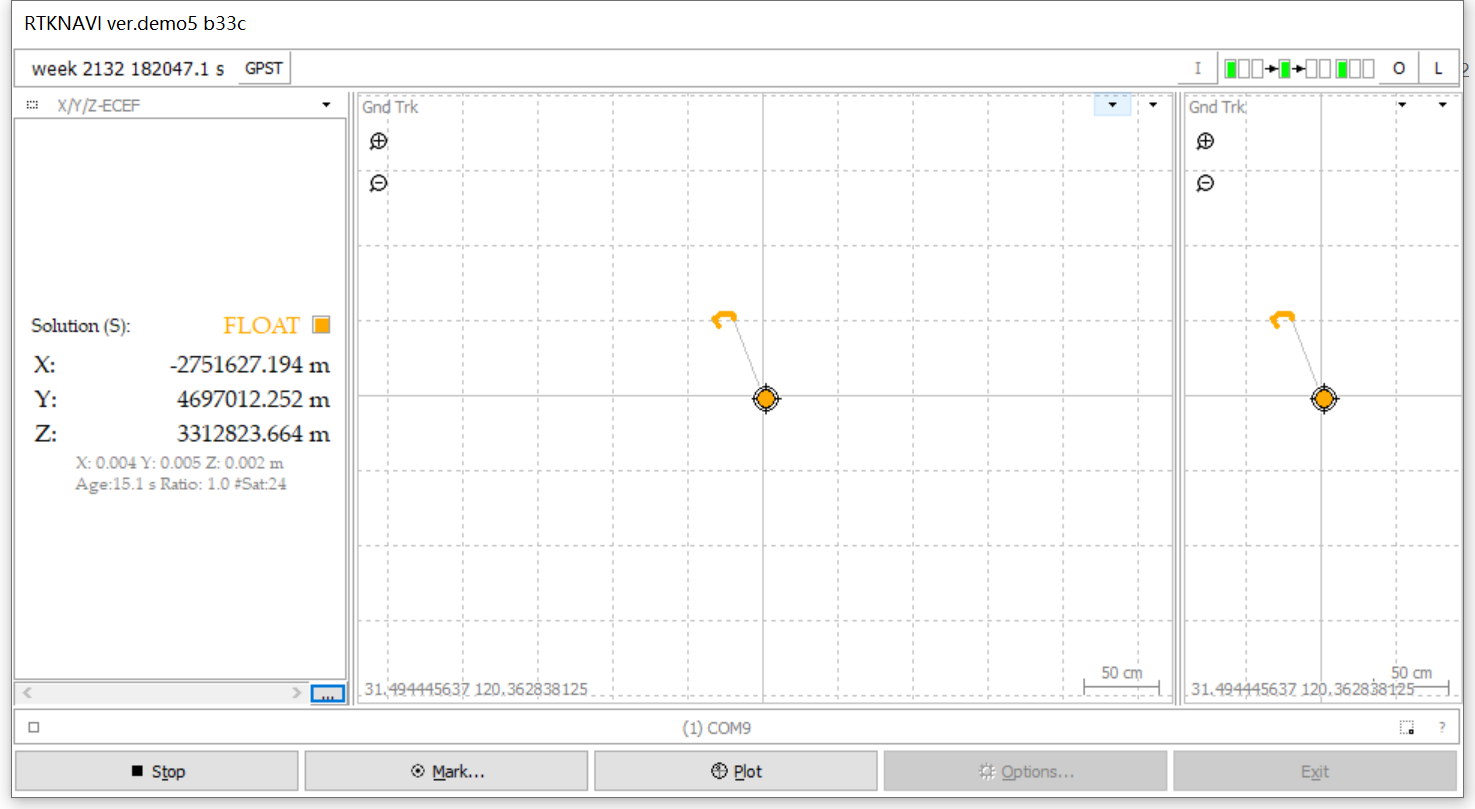
The Gnd Trk.
Click “Plot” button to Open RTKPLOT.
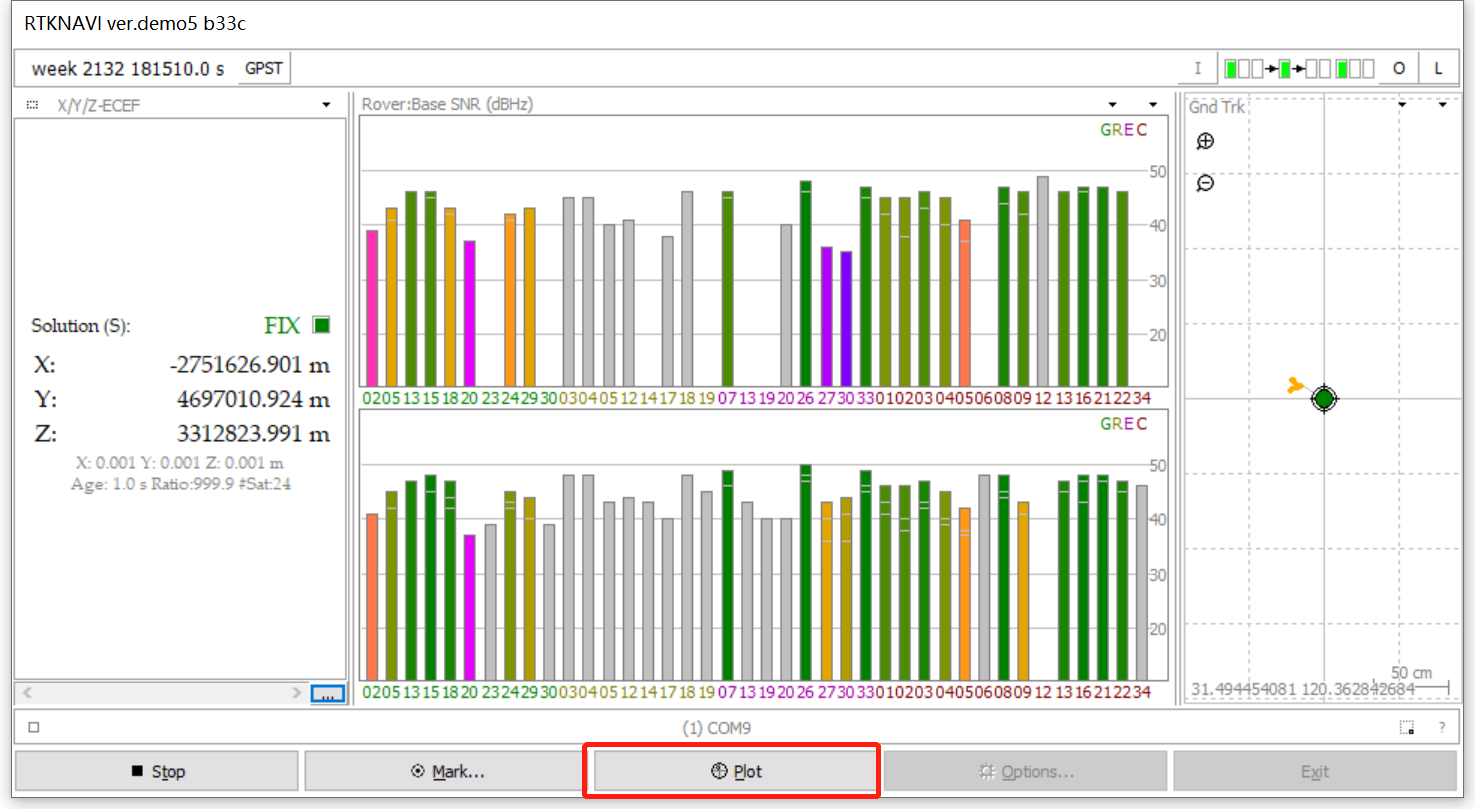
The RTKPLOT dialog.
Select the drop-down list to switch views.
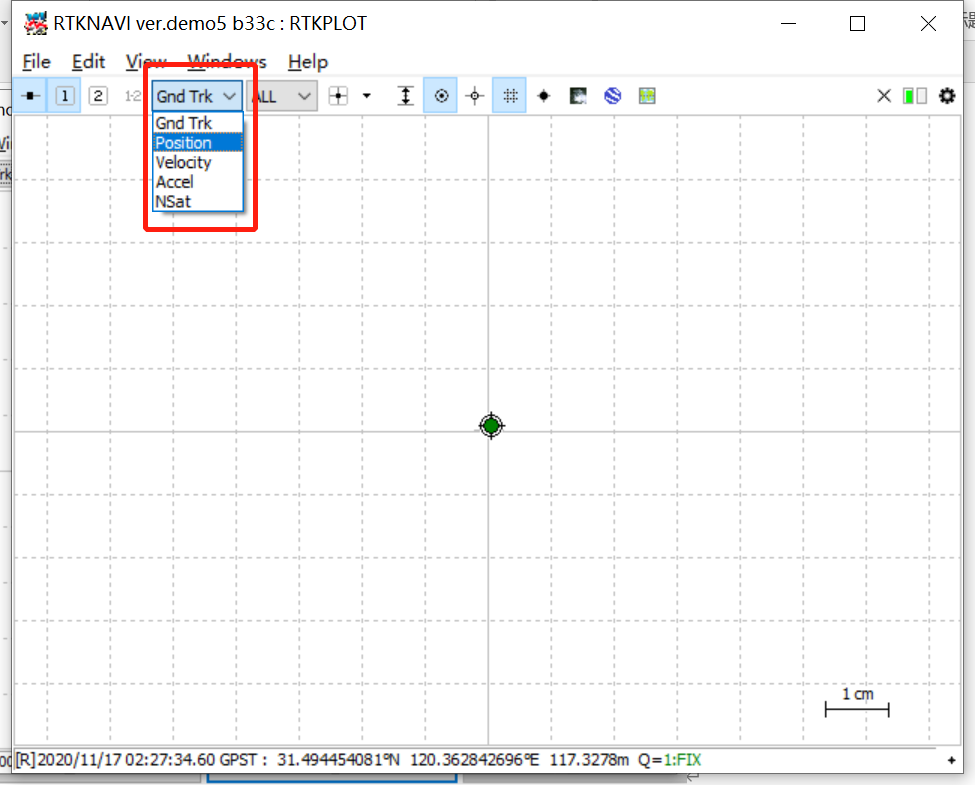
The Position views.